linear_elasticity/its2D_5.py
Description
Diametrically point loaded 2-D disk with postprocessing and probes. See Primer.
Find  such that:
where

r"""
Diametrically point loaded 2-D disk with postprocessing and probes. See
:ref:`sec-primer`.
Find :math:`\ul{u}` such that:
.. math::
\int_{\Omega} D_{ijkl}\ e_{ij}(\ul{v}) e_{kl}(\ul{u})
= 0
\;, \quad \forall \ul{v} \;,
where
.. math::
D_{ijkl} = \mu (\delta_{ik} \delta_{jl}+\delta_{il} \delta_{jk}) +
\lambda \ \delta_{ij} \delta_{kl}
\;.
"""
from __future__ import absolute_import
from sfepy.examples.linear_elasticity.its2D_1 import *
from sfepy.mechanics.matcoefs import stiffness_from_youngpoisson
from sfepy.postprocess.probes_vtk import Probe
import os
from six.moves import range
def stress_strain(out, pb, state, extend=False):
"""
Calculate and output strain and stress for given displacements.
"""
from sfepy.base.base import Struct
import matplotlib.pyplot as plt
import matplotlib.font_manager as fm
ev = pb.evaluate
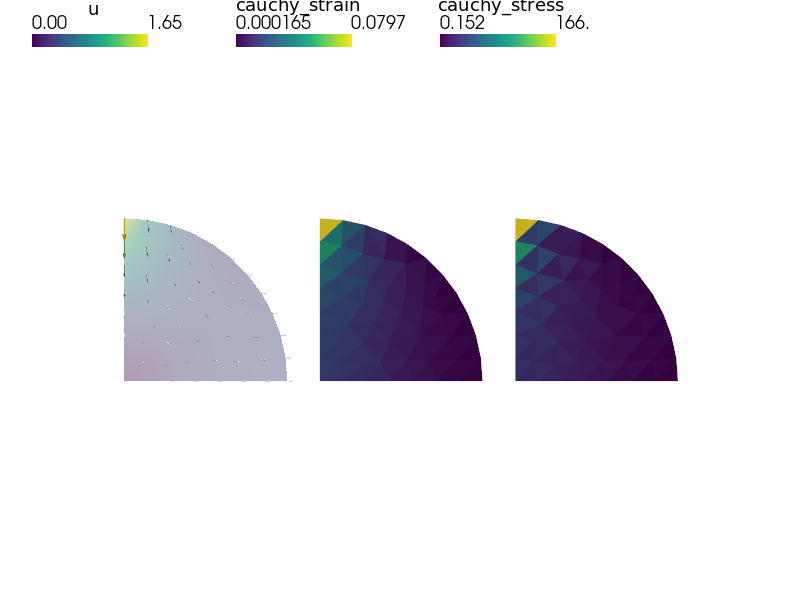
strain = ev('ev_cauchy_strain.2.Omega(u)', mode='el_avg')
stress = ev('ev_cauchy_stress.2.Omega(Asphalt.D, u)', mode='el_avg')
out['cauchy_strain'] = Struct(name='output_data', mode='cell',
data=strain, dofs=None)
out['cauchy_stress'] = Struct(name='output_data', mode='cell',
data=stress, dofs=None)
probe = Probe(out, pb.domain.mesh, probe_view=True)
ps0 = [[0.0, 0.0, 0.0], [ 0.0, 0.0, 0.0]]
ps1 = [[75.0, 0.0, 0.0], [ 0.0, 75.0, 0.0]]
n_point = 10
labels = ['%s -> %s' % (p0, p1) for p0, p1 in zip(ps0, ps1)]
probes = []
for ip in range(len(ps0)):
p0, p1 = ps0[ip], ps1[ip]
probes.append('line%d' % ip)
probe.add_line_probe('line%d' % ip, p0, p1, n_point)
for ip, label in zip(probes, labels):
fig = plt.figure()
plt.clf()
fig.subplots_adjust(hspace=0.4)
plt.subplot(311)
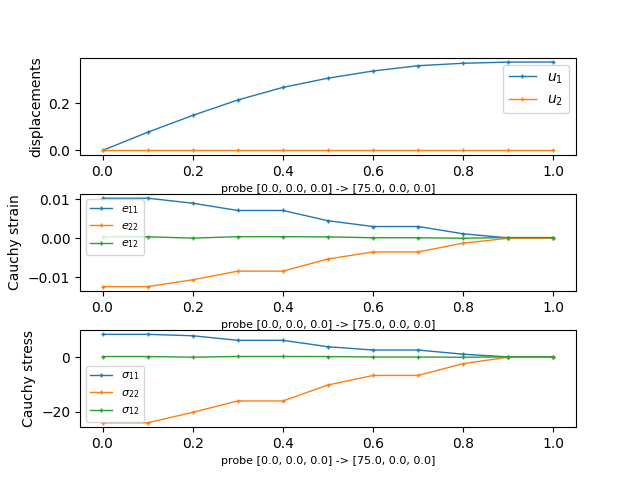
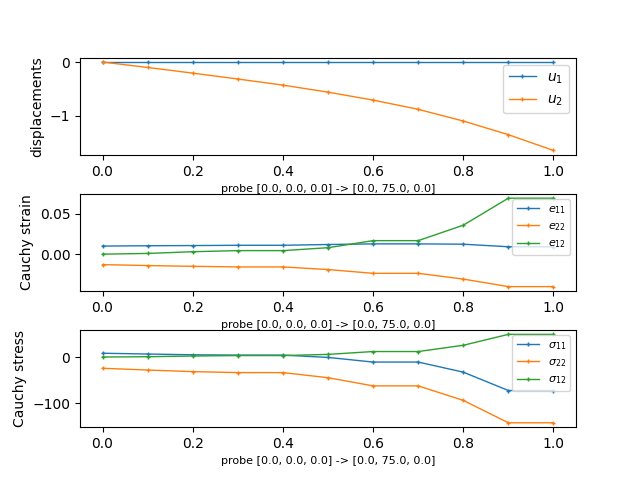
pars, vals = probe(ip, 'u')
for ic in range(vals.shape[1] - 1):
plt.plot(pars, vals[:,ic], label=r'$u_{%d}$' % (ic + 1),
lw=1, ls='-', marker='+', ms=3)
plt.ylabel('displacements')
plt.xlabel('probe %s' % label, fontsize=8)
plt.legend(loc='best', prop=fm.FontProperties(size=10))
sym_labels = ['11', '22', '12']
plt.subplot(312)
pars, vals = probe(ip, 'cauchy_strain')
for ii in range(vals.shape[1]):
plt.plot(pars, vals[:, ii], label=r'$e_{%s}$' % sym_labels[ii],
lw=1, ls='-', marker='+', ms=3)
plt.ylabel('Cauchy strain')
plt.xlabel('probe %s' % label, fontsize=8)
plt.legend(loc='best', prop=fm.FontProperties(size=8))
plt.subplot(313)
pars, vals = probe(ip, 'cauchy_stress')
for ii in range(vals.shape[1]):
plt.plot(pars, vals[:, ii], label=r'$\sigma_{%s}$' % sym_labels[ii],
lw=1, ls='-', marker='+', ms=3)
plt.ylabel('Cauchy stress')
plt.xlabel('probe %s' % label, fontsize=8)
plt.legend(loc='best', prop=fm.FontProperties(size=8))
opts = pb.conf.options
filename_results = os.path.join(opts.get('output_dir'),
'its2D_probe_%s.png' % ip)
fig.savefig(filename_results)
return out
materials['Asphalt'][0].update({'D' : stiffness_from_youngpoisson(2, young, poisson)})
options.update({
'post_process_hook' : 'stress_strain',
})